Posts

Image
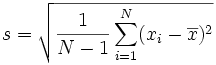
Data Analysis using descriptive statistics .. For Descriptive statistics we used different types of techniques to verify the distribution and variability of data Means, Median and mode are three function use for the descriptive statitics Mean is just average of data (sum of data /devide by total number) Media is middle number of data in case of even data just take the average of the middle numbers. Mode is just the numbers which is frequently used in data After getting all three results just compare all of these results. If you find that Mean > Median > Mode data is noy symmetrical and positive skewness is present in data and we assume that our data is not normal. If Mean is approximately equal to Median and just ignore the mode then we consider our data is normal.
Image
How to use Standard Deviation for Market Intelligence. ->What is Standard Deviation? Standard deviation is strength of your  data values  Steps to calculate the formula  1. Work out the Mean (the simple average of the numbers) 2. Then for each number: subtract the Mean and square the result 3. Then work out the mean of those squared differences. 4. Take the square root of that. Results 1 Std means 68% of strength 2 std mens 95% and 3 std means 99% strength. Simply a retail industry just make the paint size in some area he take the data of length size of persons and calculate the std and if they got the 3 std with 170 cm length they easily decide their paint length. Regards Zafarhakeeem@gmail.com +971554443206

Comparison of BI tools

Image
Today I decide  to write something which is currently most of companies wondering about  that is Business Intelligence tool selection if you select the right tool for your business intelligence you are take decision right for your business. Now Datasets are huge and growing very fast they are well comprehend using right tool. Please see the summary of some market BI tools for your business and if any further question please feel free to contact. zafarhakeeem@gmail.com +971554443206

How to Formatting numbers in Tableau

Formatting numbers in tableau Here we show the how we format the numbers like sales in tableau for this first we make a new sheet  then we drag the  sales in sheet and sheet format is automatic . Automatic simply means the computer shows that he what he think and do with your data Format currency standard For format sales go to measures sales and  click then  go to default properties go to number format and select Currency standard you can find a numbers of currency standard  there click the desire one Format currency custom You an also format the currency custom go to sales click on the default poperties go to number format . Format currency custom   Click on the format custom enter the decimal places then select the negative values then enter units then enter  prefix and post fix and select if you want the thousand separator
Image
What is Business Intelligence? BI is specific term which refers to software applications to analysis company raw data in organized form .BI is a set of processes, technologies and  applications used to provide information and support the decision making process It is Not a standard software product, it is specifically designed by consulting and targeting to particular business need . BI is broad term which capture the many things in it. Some of BI terms are SCD, MOLAP, ROLAP, Analytics, Forecasting, EIS, OLAP, KPI, SALES Intelligence, Data mart, Data Integration and MDM. Some of Business examples which used the BI solutions. In Retail System BI is use to make the strategic decisions such as what new products to add to their store, which one products need to finish and which underperforming stores to close. Another example of banks which used BI solution to analyze organizational data, banks can improve and streamline operational efficiencies to not only support sales and